
Mapping Roadways with R
Published:
My pre-calculus teacher was fond of pointing out that there are many ways to get to the local Dairy Queen. This fact of geography might easily be verified by inspecting a map, but of course there are also many, many ways to create a map. This is one such recipe for mapping roadways in R using ggplot2.
A minimal example
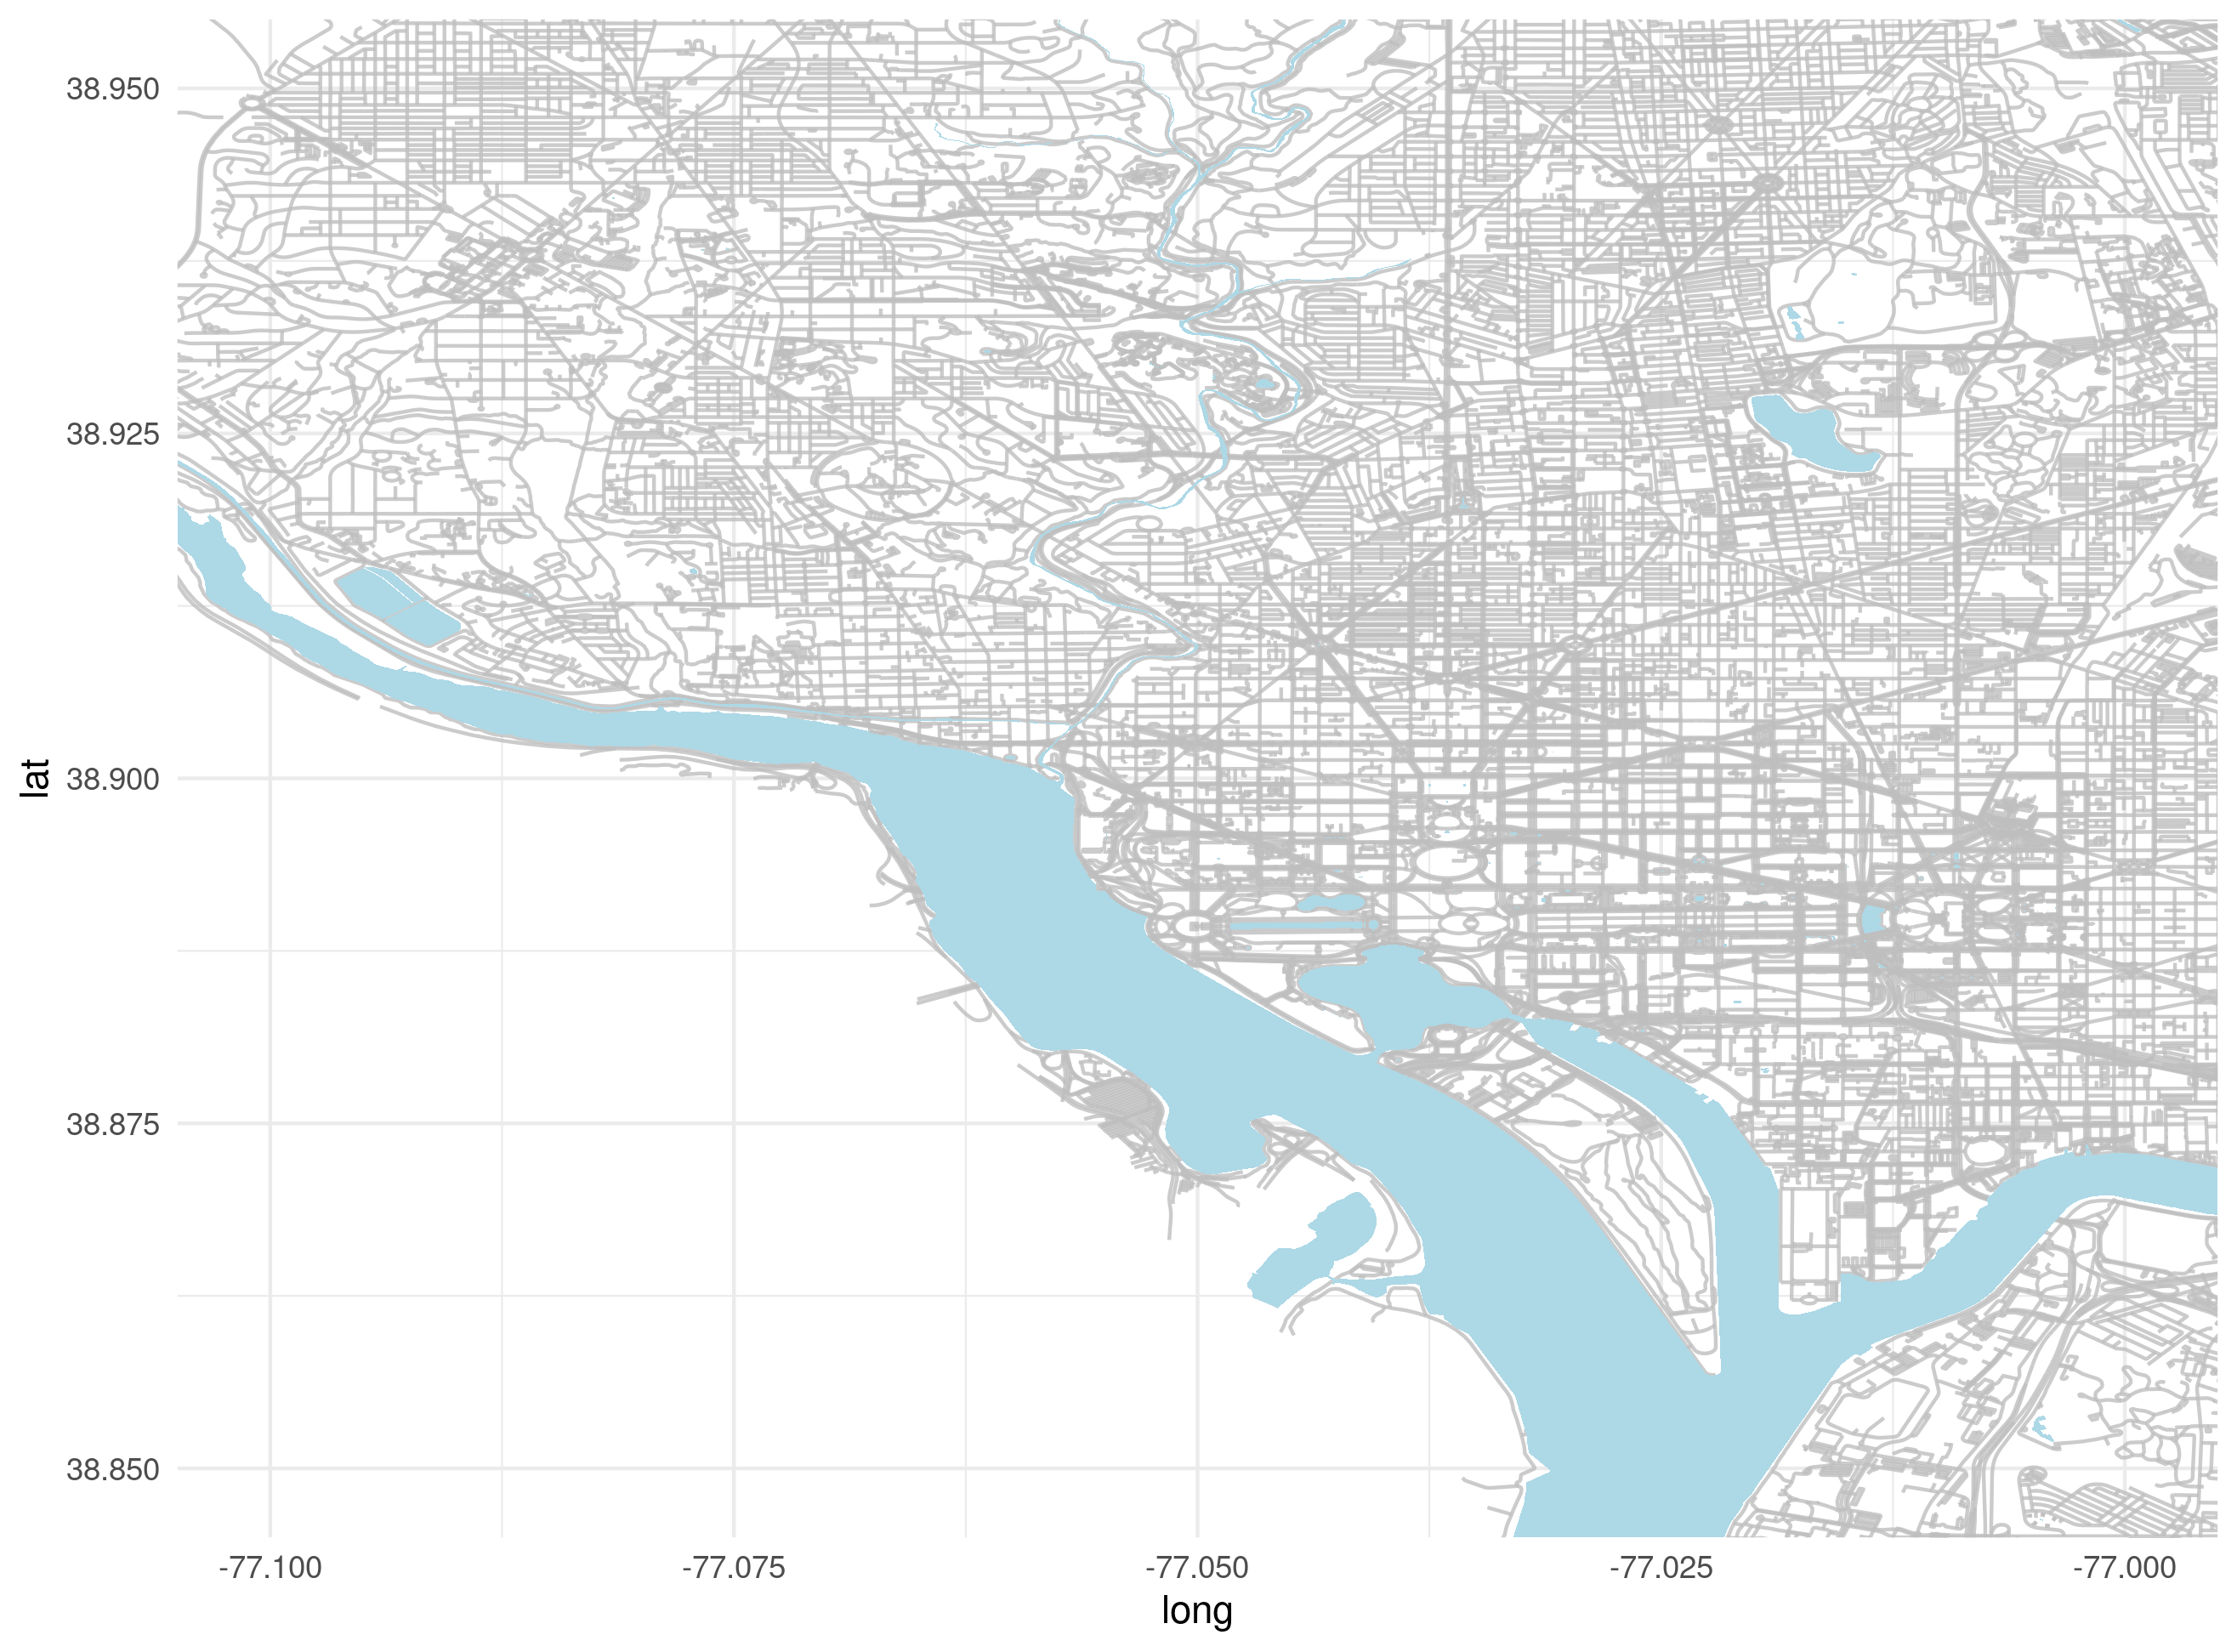
Navigate your browser to http://download.geofabrik.de/ and download the .shp file for the region of interest. The data include information on the geography and built environment of the region. For those regions with distinctive water features, a reasonable map may be obtained with just the water and roads shapefiles. I’ll use Washington, DC as an example:
The method
Import the raw water and roads shapefiles as spatial dataframes using rgdal:
library(data.table, sf, rgdal, ggplot2)

shp.water <- rgdal::readOGR(
	              dsn = ".../district-of-columbia-latest-free.shp",
                  layer = "gis_osm_water_a_free_1")

shp.roads <- rgdal::readOGR(
	              dsn = ".../district-of-columbia-latest-free.shp",
                  layer = "gis_osm_roads_free_1")
Its easier to live in ggplot2 world if we have dataframes. Use the fortify() method to convert the spatial data to vanilla dataframes (NB: broom::tidy() is an alternative to fortify).
df.water <- ggplot2::fortify(shp.water)
df.roads <- ggplot2::fortify(shp.roads)
It’s worth taking a closer look at df.roads:
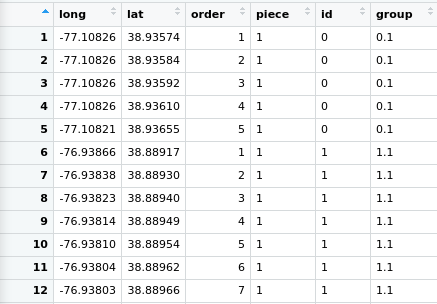
Each road segment is an ordered collection of points. The particular segment is identified by the group field. The water data is similar except that each collection of points represents a polygon instead of a line. Plotting these objects is relatively simple:
ggplot() +

  # road network
  geom_path(data = df.roads,
               aes(group = group, x = long, y = lat),
               colour = "gray", alpha = .8) +

  # water
  geom_polygon(data = df.water,
               aes(group = group, x = long, y = lat),
               fill  = "lightblue") +

  # cleaning up
  coord_cartesian(xlim = c(-77.1, -77.0), ylim = c(38.85, 38.95)) +
  theme_minimal()
ggsave(".../output.png")
The geom_path() method takes a collection of points and plots them in the order they appear in the data. The crucial option here is aes(group = group, …); it prevents unrelated roads from being connected. The geom_polygon() method does the same thing, but it also connects the first and last points and allows the inside to be colored using fill.
Particular locations may be added using geom_point().