
Trends in Roman Epigraphy
Published:
The demand for epitaphs ought to depend on several conditions: the number of Romans who died, their wealth, and the popularity of inscribed epitaphs relative to other forms of commemoration for the dead. It follows that periods of high mortality will be associated with more epitaphs. When the death rate is high, there will be relatively more subjects for epitaphs, and – in a Malthusian economy – their surviving relatives will have extra cash available for “luxury” purchases that exhibit their wealth, like high quality inscriptions.1
The city of Rome suffered a series of epidemics in the latter half of the first century.2 Tacitus writes of Rome in 65 AD:3
a terrible plague was sweeping away all classes of human beings without any such derangement of the atmosphere as to be visibly apparent. Yet the houses were filled with lifeless forms and the streets with funerals. Neither age nor sex was exempt from peril. Slaves and the free-born populace alike were suddenly cut off, amid the wailings of wives and children, who were often consumed on the very funeral pile of their friends by whom they had been sitting and shedding tears.
Two further plagues followed in 77 AD and 79/80 AD. These epidemics were local to the city, and do not appear to have spread to the rest of Italy.4 By concentrating family estates in the hands of fewer individuals with many recently-deceased relatives, it is plausible that the plagues had a measurable effect on the demand for epitaphs. Consistent with this story, the number of epitaphs dating to this period from Rome jumps sharply relative to those from the rest of the Italian peninsula:
.png)
The chart shows the total number of inscriptions dating to each half-century beginning in 50 BC until 450 AD, separately for the city of Rome and the rest of the Italian provinces. The two series track each other in every period except for 50 - 150 AD. The pattern is consistent with heighted mortality shifting out demand for inscriptions, but a single example with data in half-century buckets is at best speculative.
I review some competing hypothesis below.
What if the population or wealth of Rome increased?
If this were the case, other types of inscription might also increase in Rome, but that does not happen. Honorifics are the second most common type of inscription in Italy, and the number of honorifics decreases across all of Italy in 50 - 100 AD.
.png)
The pattern for building / dedicatory and votive inscriptions is similarly parallel between Rome and Italy during the 1st century.
What if the mortality rate in Italy fell?
If so, why did it not also fall in Rome itself? A localized increase in mortality seems more likely that a regional decrease that skipped over Rome, though the latter is no doubt possible.
Could the popularity of epitaphs have increased in Rome?
It would be strange if the popularity of epitaphs did not spill over from Rome to the rest of Italy. It possible that fads originating in Rome took time to spread throughout the peninsula, though a delay on the order of 50 years seems implausible.
A related possibility is that the popularity of epitaphs increased among a class of the population who were more likely to reside in Rome. For instance, if a larger share of Rome’s population consisted of slaves relative to Italy as a whole, and if the popularity of epitaphs among freed slaves increased starting in 50 BC, then epitaphs in Rome would increase.
Finally, it is possible that the civil war starting in 68 AD increased the political value of epitaphs located in Rome relative to the rest of Italy, perhaps as a way to advertise loyalty to Vespasian’s regime after he consolidated power.
Final Thoughts
While the evidence above is suggestive, my conclusion is that there is no clear relationship between epidemics and the demand for inscriptions. Epidemics occurred at other times and in other Roman provinces between 50 BC and 400 AD, and these plagues had no apparent effect on the production of epitaphs or any other type of inscription.
In addition, the trend is extremely sensitive to whether the inscriptions are dated at the average of the range (which tends to over-represent the latter half of each century, as many inscriptions are dated between 1 and 100, or 101 and 200), or according to a uniform draw. Ultimately, the dates are not precise enough to provide much confidence about any inferences drawn from the data. This exercise nevertheless clarified my thinking about Roman epigraphy.
Appendix
General Trends in Inscriptions
The number of inscriptions produced in the Roman Empire peaks around the 2nd century AD. The increase is not driven by a single type of inscription; instead, all inscription types grow and shrink in absolute terms while maintaining similar proportions.
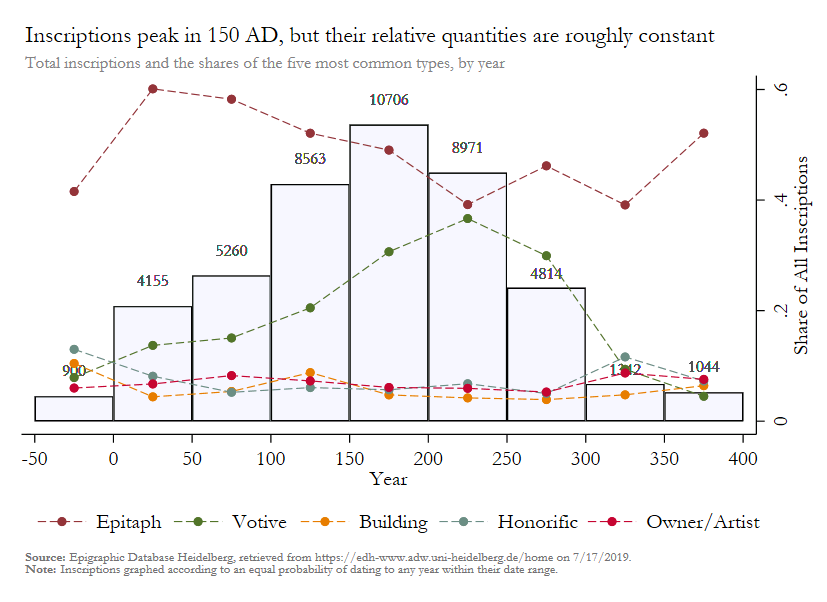
The top five types of inscription – epitaph, votive, honorific, owner/artist, and building/dedicatory – account for more than 90% of all inscriptions in the sample. Votive inscriptions accumulate share from epitaphs until around 200 AD, at which point they fall back to their initial level of 10%. Otherwise, there is little variation over the centuries.
Code
// General Trends in Inscriptions
local scatter_options "msize(small) c(1) yaxis(2) lpattern(-) lwidth(thin)"
twoway (bar tot year_bucket, fcolor(ltbluishgray) fintensity(inten60) lcolor(black) ytitle("") ///
	ylabel(0 12000, nogrid) yscale(off) yaxis(1) barwidth(50)) || ///
		(scatter frac year_bucket if type_of_inscription_code == 9, `scatter_options') || ///
		(scatter frac year_bucket if type_of_inscription_code == 22,
		`scatter_options') || ///
		(scatter frac year_bucket if type_of_inscription_code == 5, `scatter_options') || ///
		(scatter frac year_bucket if type_of_inscription_code == 10, `scatter_options') || ///
		(scatter frac year_bucket if type_of_inscription_code == 17, `scatter_options') || ///
		(scatter lab year_bucket, msym(none) mlab(tot) mlabpos(12)
		mlabcolor(gs5) mlabsize(small)), ///
		graphregion(color(white)) bgcolor(white) xlabel(-50(50)400) ///
		legend(order(3 "Epitaph" 4 "Votive" 5 "Building" 6 "Honorific" 7 "Owner/Artist") ///
			symxsize(10) cols(5) region(style(none))) ///
		title("Inscriptions peak in 150 AD, but their relative quantities are roughly constant", ///
			size(medium) pos(11) color(black)) ///
		subtitle("Total inscriptions and the shares of the five most common types, by year", ///
			size(small) pos(11) color(gs8)) ///
		xtitle("Year") ytitle("Share of All Inscriptions", axis(2)) ///
		note("{bf:Source:} Epigraphic Database Heidelberg, retrieved from https://edh-www.adw.uni-heidelberg.de/home on 7/17/2019." ///
			 "{bf:Note:} Inscriptions graphed according to an equal probability of dating to any year within their date range.", ///
			 color(gs7) size(vsmall))
Sources
Similarly, the Black Death “concentrated wealth, often substantial family fortunes, in fewer and younger hands…. Even with a reduced population, the gross volume of luxury goods manufactured and sold rose.” See Rout, David. “The Economic Impact of the Black Death”. EH.net Encyclopedia, edited by Robert Whaples. July 20, 2008. http://eh.net/encyclopedia/the-economic-impact-of-the-black-death/ ↩
Harper, Kyle. “Database of Pestilence in the Roman Empire”. KyleHarper.net, August 24, 2017, https://www.kyleharper.net/uncategorized/database-of-pestilence-in-the-roman-empire/ ↩
Tacitus Ann 16.13. From Complete Works of Tacitus. Alfred John Church. William Jackson Brodribb. Sara Bryant. edited for Perseus. New York: Random House, Inc. reprinted in 1942. ↩
Harper, Kyle. “Database of Pestilence in the Roman Empire”. Harper notes that “interregional events – spreading beyond one province or so – were rare before the outbreak of the Antonine Plague. It seems unlikely that pandemics occurred but went unattested.” ↩