An Epigraphy Gif
Published:
Try saying that five times fast.
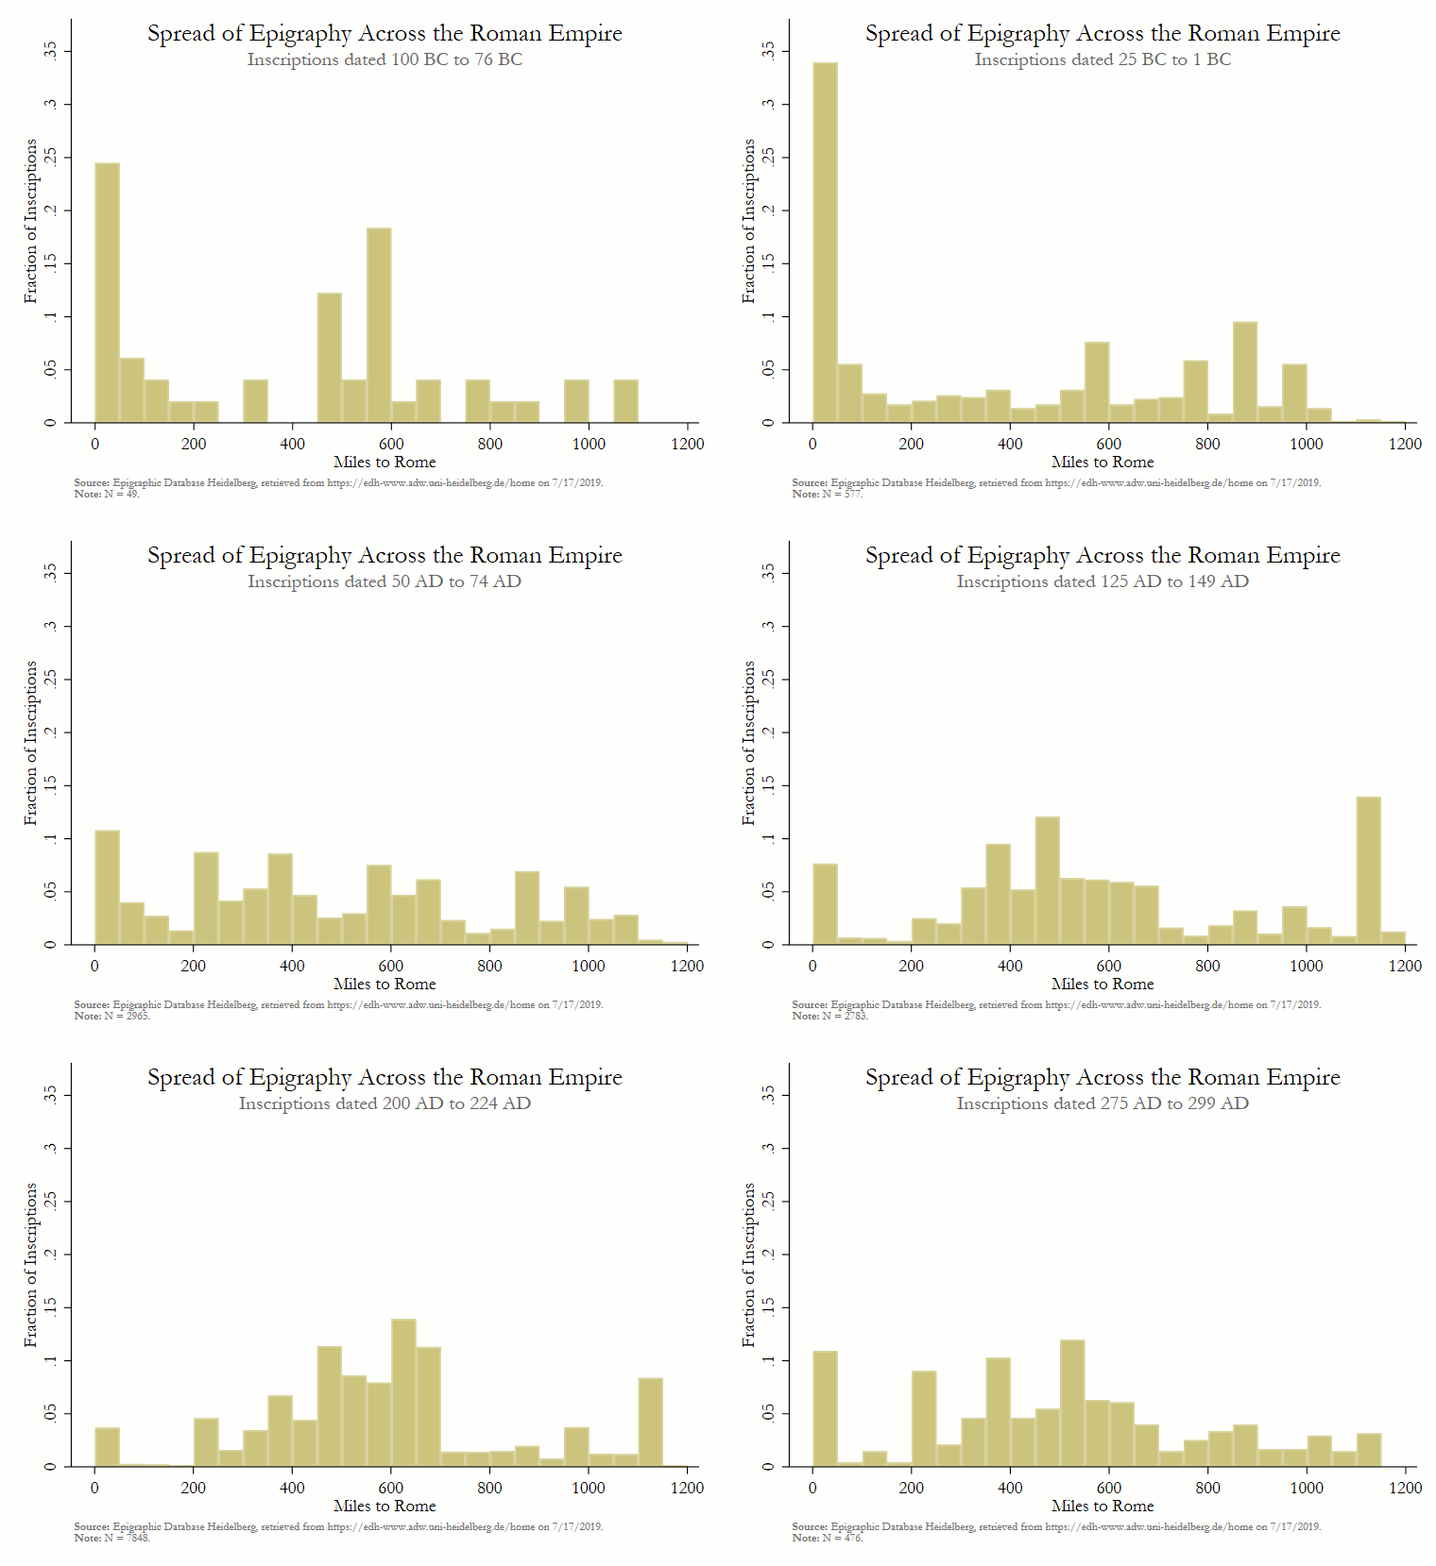
The gif below illustrates the spread of epigraphic writing across the empire. In 100BC, almost 40% of inscriptions come from Rome itself, but by 200 AD that share falls to below 10%. In general, the distribution shifts away from Rome, but unevenly.

The concentration of inscriptions between 200 and 250 miles from Rome come primarily from the province of Dalmatia, a Balkan region particularly well-documented in the EDH dataset.
What Deserves to be Read
True glory consists in doing what deserves to be written; in writing what deserves to be read.
- Pliny the Elder
Everyone decides what deserves to be read and what does not.
Or these days, what deserves to be shared and what does not. Whether by Facebook post, votive offering, or yearbook quotation, these forms of public writing are distinguished in several ways. They are short and often formulaic. They are composed by unpaid amateurs. And they are cheap to publish.
Why do people employ these mediums? What determines the content of their writing? I don’t know anything about epigraphy or mind of an ancient Roman. I do have instincts about social media, though, and it seems to me that the two are not entirely unrelated.
Some observations:
The risk that someone finds your statement offensive increases with the size and heterogeneity of your audience. My sense is that people posted more on Facebook when their friends list consisted of their true-to-life friends, and not their extended family, coworkers, and old HS teachers.
Wilson (2014) suggests that epigraphy was driven by “local political competition between elites.” If this is the case, then we should observe more epigraphic writing during periods of local political turbulence when newcomers attempt to dislodge incumbents. The key word is local. Elites used epigraphic writing to improve their standing within the Roman political system, but existential threats to that system would lower the expected value of local political capital.
Sources
Steiner, Jakub. “Simple Animations.” 2002. https://www.gimp.org/tutorials/Simple_Animations/.
Find the image code below:
use "working.dta", clear

	gen year_unif = runiform(not_before, not_after)
	egen year_bucket =  cut(year), at(-100(25)500)

	graph set window fontface "Garamond"

	forvalues i=0/15 {

		local yr `=-100 + 25 * `i''
		sum if year_bucket == `yr' & dist_rome < 1200
		scalar N = `r(N)'

		if `yr' < 0 {
			local time1 "`=`yr'*-1' BC"
			local time2 "`=`yr'*-1-24' BC"
		}
		else if `yr' > 0 {
			local time1 "`yr' AD"
			local time2 "`=`yr'+24' AD"
		}
		else {
			local time1 "1 AD"
			local time2 "`=`yr'+24' AD"
		}

		hist dist_rome if year_bucket == `yr' & dist_rome < 1200, xlabel(0(200)1200) width(50) frac ///
			xscale(range(0 1200)) yscale(range(0 .37)) ylabel(0(.05).35, nogrid) ///
			title("Spread of Epigraphy Across the Roman Empire", color(black) ring(0)) ///
			subtitle("Inscriptions dated `time1' to `time2'", color(gs6) ring(0) margin(0 0 0 6)) ///
			graphregion(color(white)) bgcolor(white) xtitle("Miles to Rome") ///
			ytitle("Fraction of Inscriptions") ///
			note("{bf:Source:} Epigraphic Database Heidelberg, retrieved from https://edh-www.adw.uni-heidelberg.de/home on 7/17/2019." ///
				 "{bf:Note:} N = `=N'.", color(gs7) size(vsmall))
		// pause
		graph export "output/spread frames/Frame `yr'.png", width(760) replace
	}
