Productivity in Manufactured Housing
March 1, 2026
Aggregate data point to a large and decades-long decline in U.S. construction sector productivity. Value added per worker in 2020 was roughly 40 percent below its 1970 level, a remarkably poor record for a major sector.Austan Goolsbee and Chad Syverson, “The Strange and Awful Path of Productivity in the U.S. Construction Sector,” Working Paper, Working Paper Series (National Bureau of Economic Research, January 2023), https://doi.org/10.3386/w30845. Conversely, in manufacturing industries where goods can be produced in factories, productivity has risen substantially over time.Brian Potter, The Origins of Efficiency (Stripe Press, 2025).
What about manufactured housing?
Manufactured homes are immune to many of the frictions that are often blamed for poor construction productivity: unpredictable weather, fragmented local building codes, and the complex coordination of multiple subcontractors on a construction site. These complications are absent from the production process for manufactured homes, which are assembled indoors in a controlled environment and have been regulated by a single federal code since 1976. However, like site-built construction, manufactured homes remain subject to boom-bust cycles in production and high transportation costs, limiting the incentive for firms to make large capital investments that would sit idle during recessions. Thus, the sector offers a natural test case: are site-specific problems, like frictions in land assembly or a heavy reliance on contractors, the main culprits behind poor construction productivity, or is the fundamental problem with general forces, like demand volatility and transportation costs, that affect all types of construction?
I start by studying physical output measures. The story is grim: manufactured housing (MH) shipments per employee fell by roughly half between the mid-1990s and the mid-2000s and have never fully recovered. In terms of raw output, MH productivity appears dismal.
Units per worker, however, treats every home equally: a small single-wide counts the same as a large double-wide. After the demand collapse of the early 2000s wiped out the low-end chattel-lending market, the remaining buyers demanded larger, higher-quality units. When the product mix shifts toward more expensive homes, units per worker can fall even as dollar-valued productivity holds steady. To better account for quality, I turn to real value added per employee, from the NBER-CES database, to measure the dollar value the industry adds per worker, adjusted for inflation and net of materials costs.The NBER-CES deflator is based on the Producer Price Index for manufactured housing, which tracks prices for specific product categories over time. It is not hedonic, so within-product quality improvements — better insulation or appliances at a given price point — are not recognized as output gains. To the extent that such improvements occurred, real value added understates true performance.
This series tells a slightly different story: labor productivity grew steadily from the late 1950s through the 1990s, then stagnated after 2000 rather than collapsing outright. The divergence between falling units per worker and flat value added per worker is consistent with a composition shift toward larger, more expensive homes. At the same time, however, value added in similar wood product manufacturing industries continued to grow, suggesting that something specific to the MH industry caused its relative stagnation.
Measures of total factor productivity (TFP), which strip out the contribution of capital along with other inputs, suggest an even starker post-2000 collapse. After years of moderate growth, the NBER-CES TFP index for the MH sector fell by over 40% between 1999 and 2015, a stark divergence from related manufacturing industries.
MH are not immune to the construction productivity puzzle. Indeed, they appear to have performed even worse than site-built construction, especially after 2000.
Data
I combine two data sources to construct a national panel of manufactured housing productivity from 1958 to 2018.
Census Manufactured Housing Survey (MHS). The MHS provides annual counts of manufactured home shipments and placements, average sales prices by unit type (single-wide and double-wide), and state-level shipment detail. The shipments series extends back to 1959.
NBER-CES Manufacturing Industry Database. The NBER-CES database provides annual data on employment, value added, shipments, materials costs, capital stocks, and total factor productivity for all U.S. manufacturing industries at the six-digit NAICS level from 1958 to 2018.Randy Becker, Wayne Gray, and Jordan Marvakov, “NBER-CES Manufacturing Industry Database (1958-2018, Version 2021a),” 2021. Value added is deflated using the industry-specific shipments price deflator, and the four-factor TFP index accounts for labor, capital, energy, and materials inputs.
Results
Physical output per employee
I first examine units of housing output per employee for manufactured housing. MH shipments per worker averaged above five units per employee through the mid-1990s, then fell sharply to roughly 2.5 units by the mid-2000s.
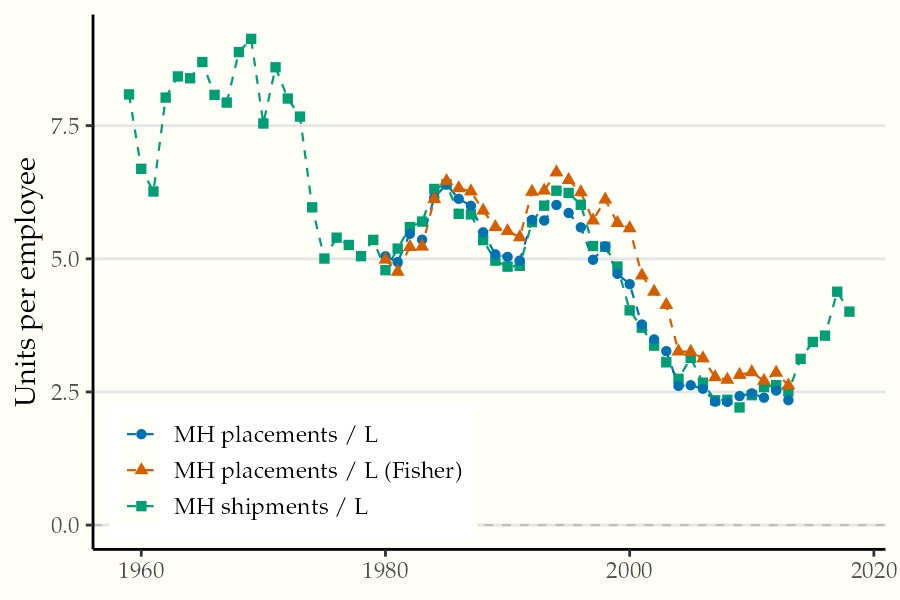
Notes: MH placements and shipments per employee. Fisher placements are a price-weighted aggregate of single- and double-wide placements. Source: Census MHS and NBER-CES Manufacturing Industry Database.
This decline in physical output is partly the consequence of large and rapid changes in demand. Financing for MH collapsed in the early 2000s, eliminating the lowest-income buyers and shifting industry output to satisfy the remaining customers, with better credit and demand for larger, higher-quality units. The share of double-wide placements rose from 50% of units in 1996 to over 75% in 2003.
I adjust for this shift by constructing a price-weighted Fisher aggregate of single- and double-wide placements per employee. This measure accounts for the shift in the mix of units over time by weighting the quantity of single- and double-wide placements by their prices. Importantly, it cannot capture quality improvements within unit types. The Fisher aggregate shows a similar post-2000 decline, though the drop is slightly less severe.
Real value added per employee
I turn next to a measure of real value added per employee from the NBER-CES database. In contrast to the physical output measure, labor productivity shows a long upward trend since 1958: from a base of $22,000, real value added per worker roughly tripled over the next forty years to $63,000 (1997 dollars). Post-2000, value-added stagnated but did not fall, and by the late 2010s value added per employee remained near its peak.
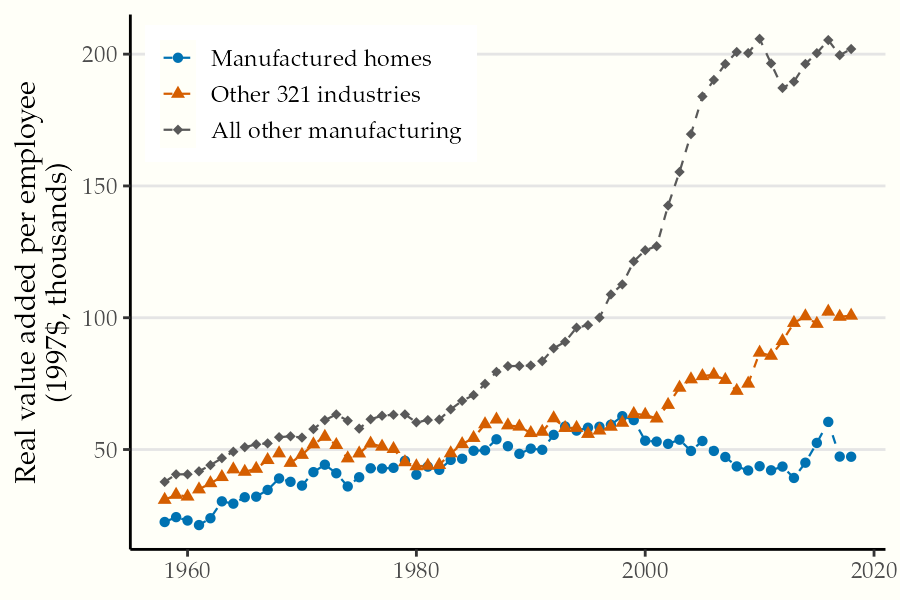
Notes: Value added deflated by shipments price index (1997 = 1.0). Comparison series are aggregates for other NAICS 321 (wood product manufacturing) industries. Source: NBER-CES Manufacturing Industry Database.
At the same time, however, the industry performed much worse than comparable manufacturing sectors. Wood product manufacturing industries grew steadily through the 2000s, ending the 2010s with nearly double the real value added per employee of MH despite starting at a similar level in the 1990s.Falling input prices, such as lumber, could in principle affect measured real value added per worker. However, other wood product manufacturing industries faced the same input price changes, so this force alone cannot explain the MH-specific divergence.
The most likely explanation for the divergence between raw output and value-added measures is that the composition of output shifted towards higher-quality, more expensive units. This shift is consistent with gradual increases to minimum standards in the federal HUD code, especially for wind and energy standards during the mid-1990s, which raised the quality of the product.Joseph B. Treaster and Henry Fountain, “Considered Vulnerable, Mobile Homes Are Battered but Largely Intact,” The New York Times, September 2017, https://www.nytimes.com/2017/09/14/us/mobile-homes-florida-irma.html.
Total factor productivity
Finally, I plot the NBER-CES four-factor TFP index, which adjusts for labor, capital, energy, and materials inputs, for manufactured housing and Domar-weighted aggregates of other manufacturing industries.Aggregate TFP series for comparison groups are constructed following Evsey D Domar, “On the Measurement of Technological Change,” The Economic Journal 71, no. 284 (1961): 709–29. For each group, the annual TFP growth rate is a weighted average of constituent industries’ four-factor TFP growth rates, where the weight on each industry is its lagged gross output (shipments) as a share of the group’s lagged aggregate value added. These Domar weights sum to greater than one, reflecting the fact that an industry’s productivity gain raises the effective output of downstream users of its products. The weighted growth rates are cumulated from a base of 1.0 in 1997. The story is quite similar to value added: MH TFP rose steadily between 1960 and 1999, then declined precipitously to 0.54 by 2013. The partial recovery to 0.65 by 2016 still leaves TFP well below its level in 1960.
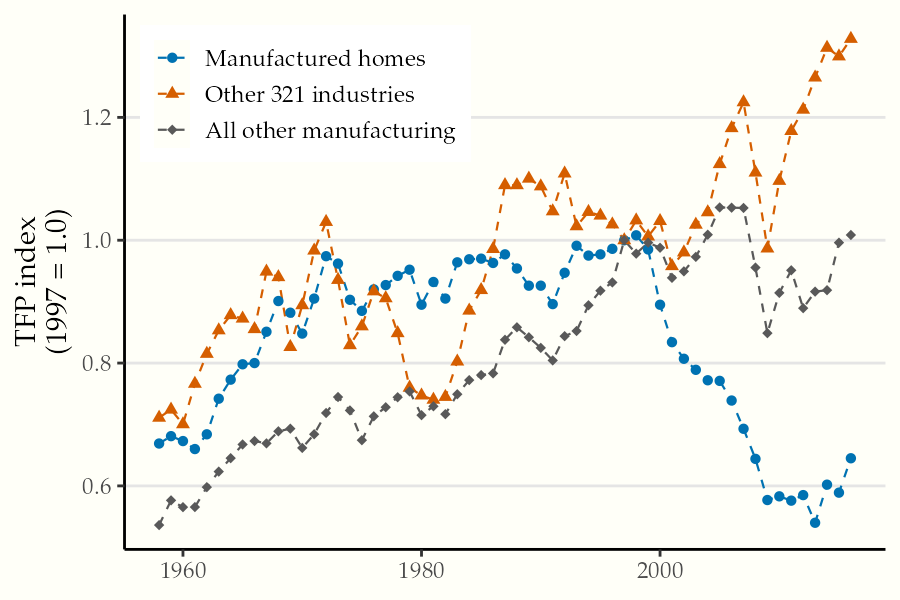
Notes: Four-factor TFP index using labor, capital, energy, and materials inputs. Base year 1997 = 1.0. Comparison series are Domar-weighted aggregates of annual industry TFP growth for other NAICS 321 (wood product manufacturing) industries. Source: NBER-CES Manufacturing Industry Database.
By contrast, other wood product manufacturing industries show no break in trends around 2000. MH’s productivity collapse was not part of a broad manufacturing phenomenon.
The juxtaposition of the figures above implies that labor productivity recovered only through capital deepening: firms invested in more capital per worker, but the efficiency with which they combine all inputs deteriorated dramatically. Manufactured housing factories, despite their controlled environment, standardized processes, and federal regulation, have not escaped the forces holding down construction productivity.
Discussion
The TFP collapse after 1998 coincides almost exactly with the demand shock that hit manufactured housing when the subprime chattel-lending channel dried up. MH shipments fell from roughly 375,000 units per year at their late-1990s peak to fewer than 80,000 by the mid-2000s, a massive decline from which the industry has never recovered. One interpretation of the TFP decline is that it reflects lost economies of scale rather than technological regress.
The scale interpretation has both within-plant and market-level dimensions. Within each factory, high fixed costs — the plant itself, jigs, tooling, and quality-control infrastructure — must be spread over output. When volumes collapsed, factories that once operated at efficient scale were left with excess capacity, mechanically depressing measured productivity. But the geographic fragmentation of the industry compounds this problem. Transport costs for finished manufactured homes are steep (about $13–14 per mile), so each factory serves a limited radius.Maris Jensen, “Manufactured Housing and Market Foreclosure” (Working Paper, 2024). Unlike a typical manufacturing industry, MH producers cannot respond to falling demand by consolidating into fewer, larger plants: a factory in Alabama cannot absorb the customers of a shuttered plant in Oregon. Some regional markets may simply be unable to sustain a factory at efficient scale, with no prospect of consolidation.
The severity of the demand shock also makes it unlikely that standard reallocation forces offset the productivity decline. In a Melitz-style framework, negative demand shocks should induce the least productive firms to exit, raising average productivity among survivors. The fact that MH TFP fell sharply despite substantial industry contraction suggests that the loss of scale economies dominated any cleansing effect from the exit of low-productivity plants.
A lack of scale economies may also explain the poor performance of site-built construction. Leonardo D’Amico et al.“Why Has Construction Productivity Stagnated? The Role of Land-Use Regulation,” Working Paper, Working Paper Series (National Bureau of Economic Research, November 2024), https://doi.org/10.3386/w33188. argue that fragmented local regulations prevent large, efficient builders from producing standardized homes on large greenfield sites, a mode of production that was historically more common and which contributed to the industry’s productivity growth in the years after World War II.
At the same time, the scale interpretation has a silver lining. If the post-2000 productivity collapse reflects lost volume rather than technological regress, then the production knowledge still exists and factories can be efficient — they just need demand. Reforms to titling and financing — for example, making manufactured homes eligible for conventional mortgage products — could expand the buyer pool and set off a virtuous cycle: higher volumes would lower unit costs, which would lower prices, which would attract additional buyers at the margin. Because the industry is likely operating on the steep portion of its average cost curve, even modest demand increases could yield disproportionate productivity gains.
The geographic structure of the industry, however, limits how far this logic can run. Because high transport costs confine each factory to a limited radius, national demand growth must translate into regionally distributed demand growth to restore scale at individual plants. Full recovery to 1990s volumes appears unlikely given secular headwinds — falling fertility, regulatory fragmentation, and the permanent loss of the subprime chattel-lending channel. For both site-built and manufactured homes, structural features of the industry limit the size of the market, prevent learning-by-doing, and raise the cost of housing.
Code and data for this essay are available on GitHub.
I am grateful to Tyler Pullen for his feedback on an early draft of this essay.
Tags: housing, productivity