The Geography and Evolution of Roman Public Writing
July 17, 2019
What Deserves to be Written?
True glory consists in doing what deserves to be written; in writing what deserves to be read.
— Pliny the Elder
Across the Roman Empire, ordinary people inscribed the significant events of their lives on stone. These inscriptions – recording deaths, vows to the gods, public decrees, and personal achievements – represent one of history’s most extensive examples of public writing. Like social media posts, votive offerings, or yearbook quotations, Roman epigraphy was distinguished by several characteristics: it was short and often formulaic, composed by unpaid amateurs, and relatively cheap to publish.
But why did people choose to write publicly? What determined the content and geographic spread of their inscriptions? The parallels to modern forms of public expression – and particularly social media – offer instructive insights.
Consider the dynamics that shape public writing today. The risk that someone finds your statement offensive increases with the size and heterogeneity of your audience. Many people posted more freely on Facebook when their friends list consisted of their true-to-life friends, rather than extended family, coworkers, and old high school teachers. The same principle likely influenced Roman inscriptions: local audiences with shared cultural frameworks enabled more expressive and varied public writing.
Wilson suggests that epigraphy was driven by “local political competition between elites.”Wilson, Andrew I. 2014. “Quantifying Roman Economic Performance by Means of Proxies : Pitfalls and Potential.” Edited by Francois de Callatay, 147-67. Pragmateiai. Edipuglia. https://ora.ox.ac.uk/objects/pubs:503490 If true, we should observe more epigraphic writing during periods of local political turbulence, when newcomers attempted to dislodge incumbents. The key word is local. Elites used epigraphic writing to improve their standing within the Roman political system, but existential threats to that system would lower the expected value of local political capital.
This framework helps us understand not just the motivations behind Roman public writing, but also its geographic patterns and temporal evolution. The inscriptions reveal two fundamental patterns that illuminate the social and economic dynamics of the Empire.
Two Stylized Facts About Roman Epigraphy
Fact 1: Epigraphy was Geographically Concentrated
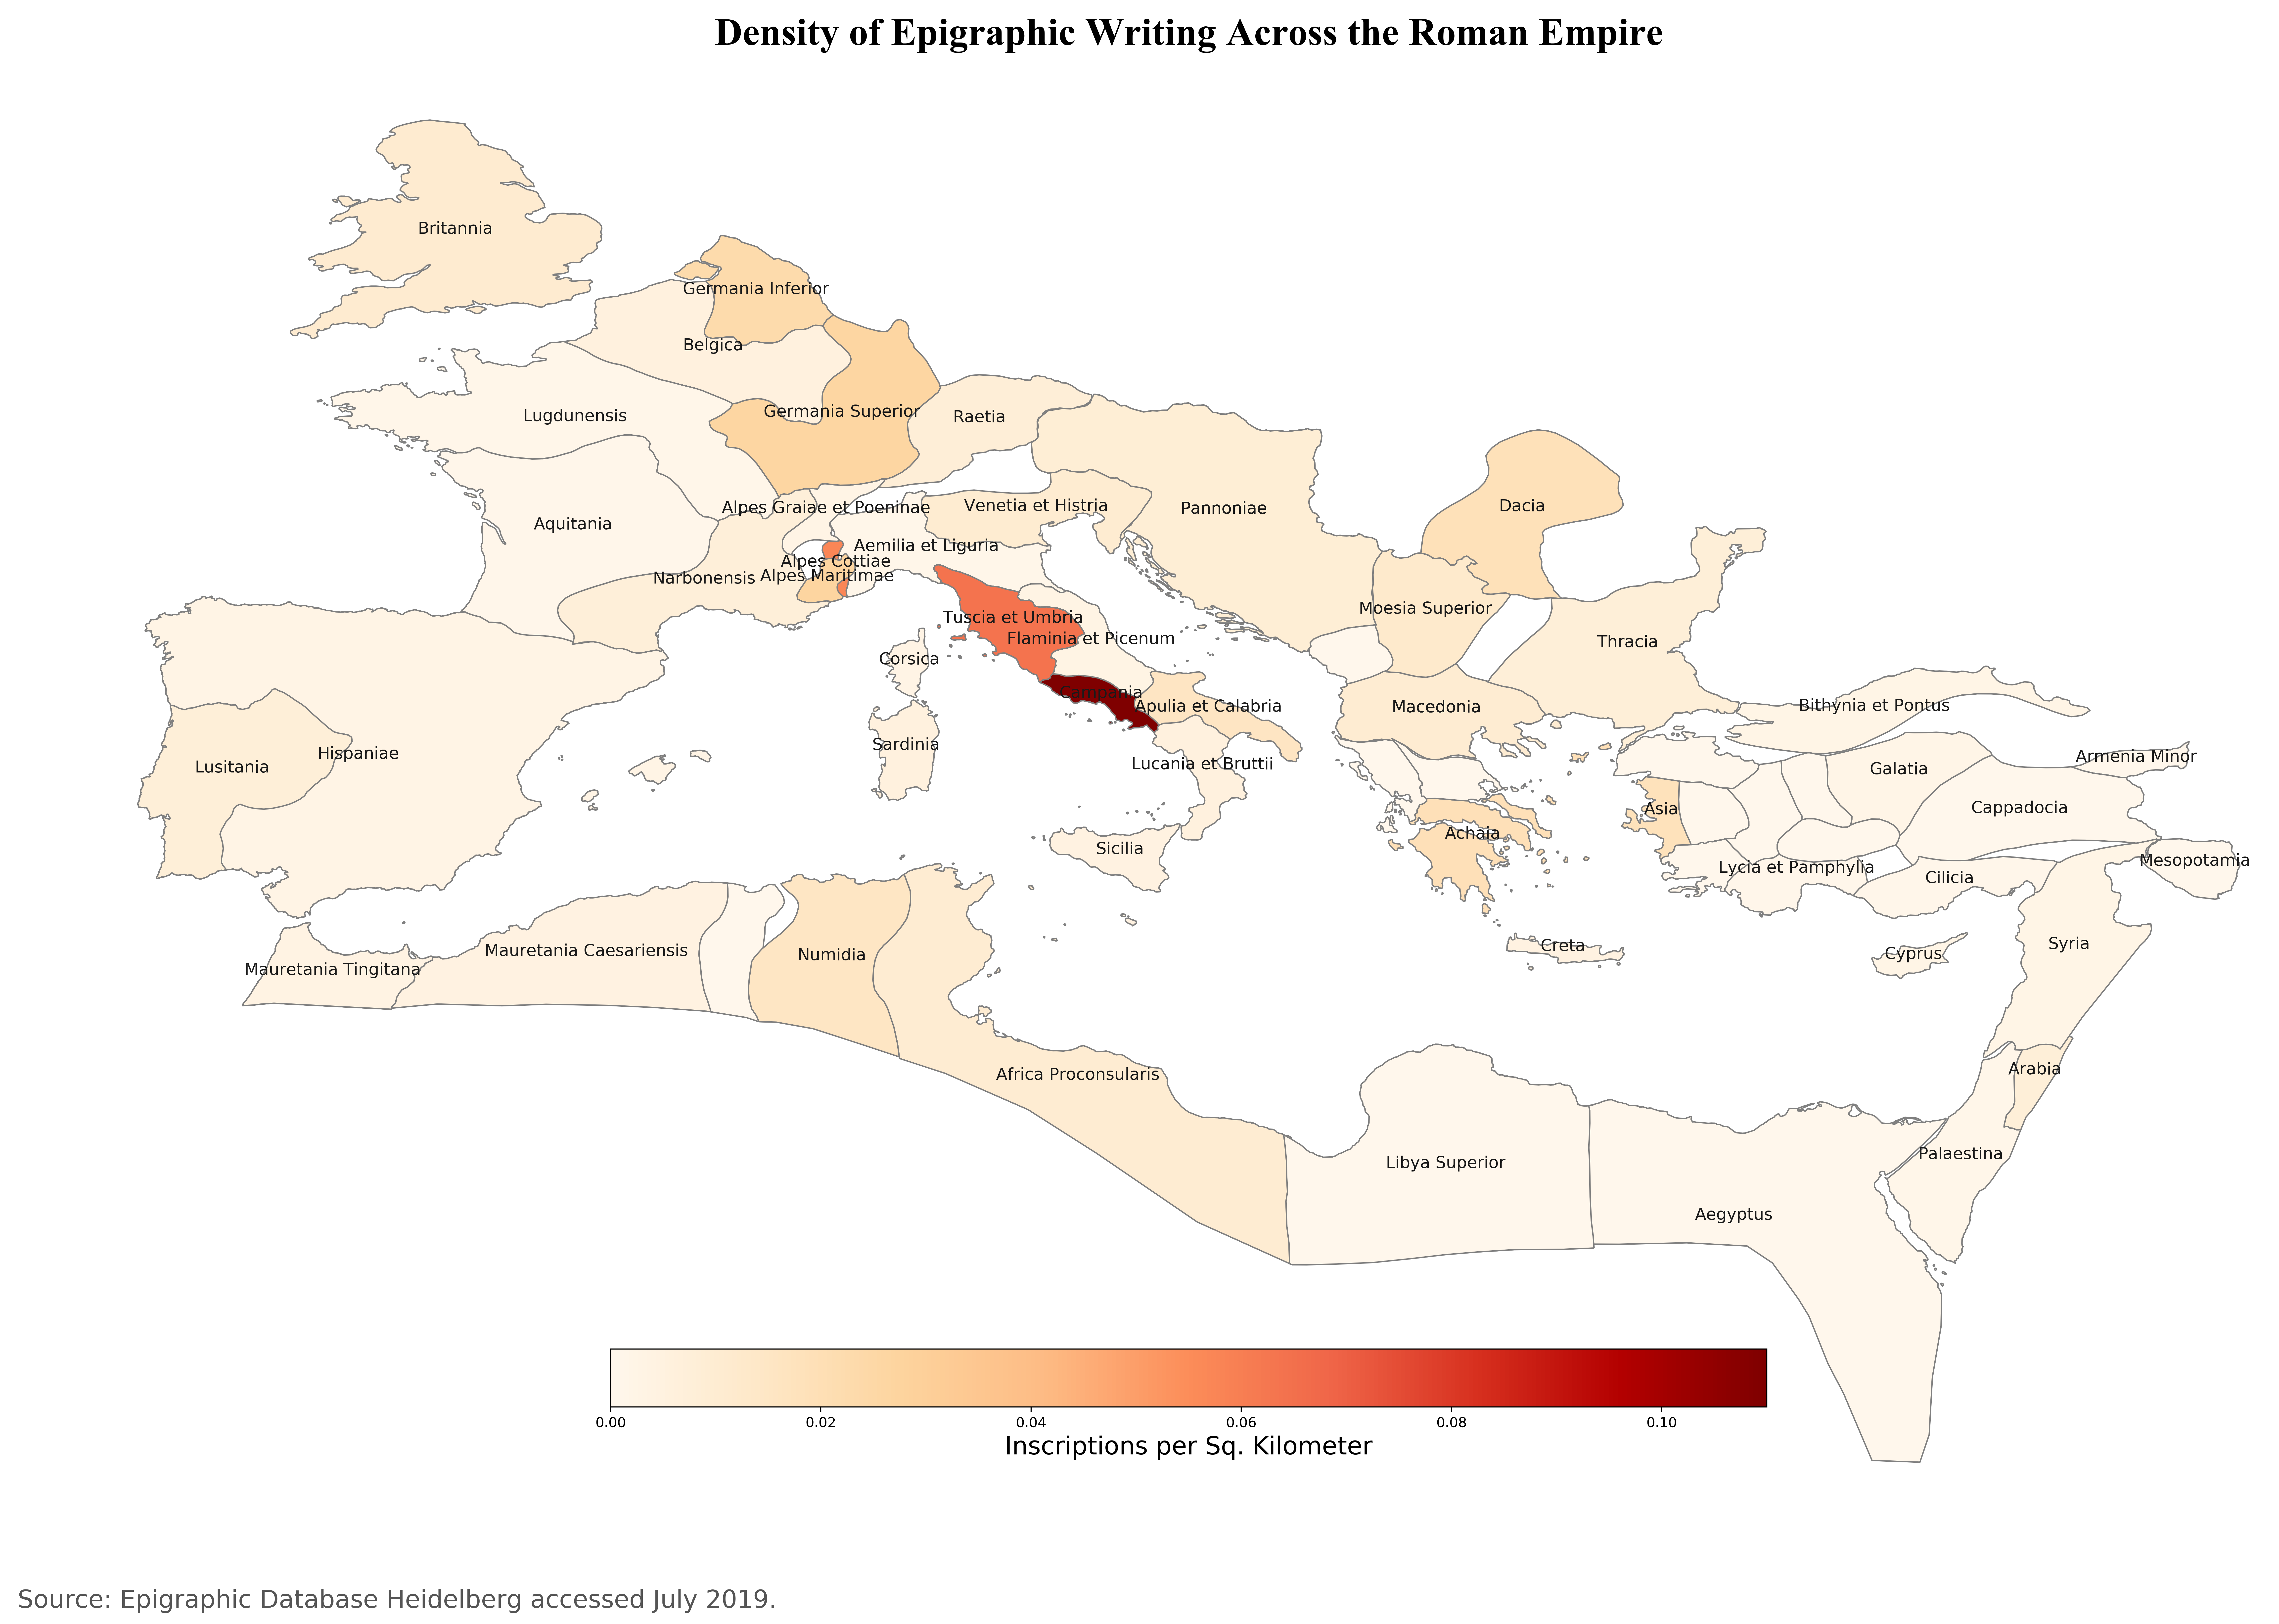
Most Roman epigraphy was heavily concentrated around the capital, but the practice extended throughout the Empire’s provinces. The map below, based on all 76,652 geo-located inscriptions from the Epigraphic Database Heidelberg, shows the density of inscription writing across Italy and surrounding regions.

The highest concentration of writing comes from the immediate vicinity of Rome itself, reflecting both the city’s population density and its role as the political and cultural center of the Empire. However, the practice of epigraphic writing extended far beyond Italy, reaching Greece, Germany, Northern Africa, and parts of Asia Minor. This geographic spread demonstrates how Roman cultural practices – including forms of public expression – diffused throughout the conquered territories.
The pattern suggests that epigraphy served both universal human needs (commemorating the dead, recording achievements) and specifically Roman institutional functions (participating in local political competition, demonstrating cultural integration). The concentration around Rome reflects the Empire’s centralized structure, while the broad geographic spread shows the deep penetration of Roman social practices.
Fact 2: Epigraphy Gradually Shifted Away from Rome
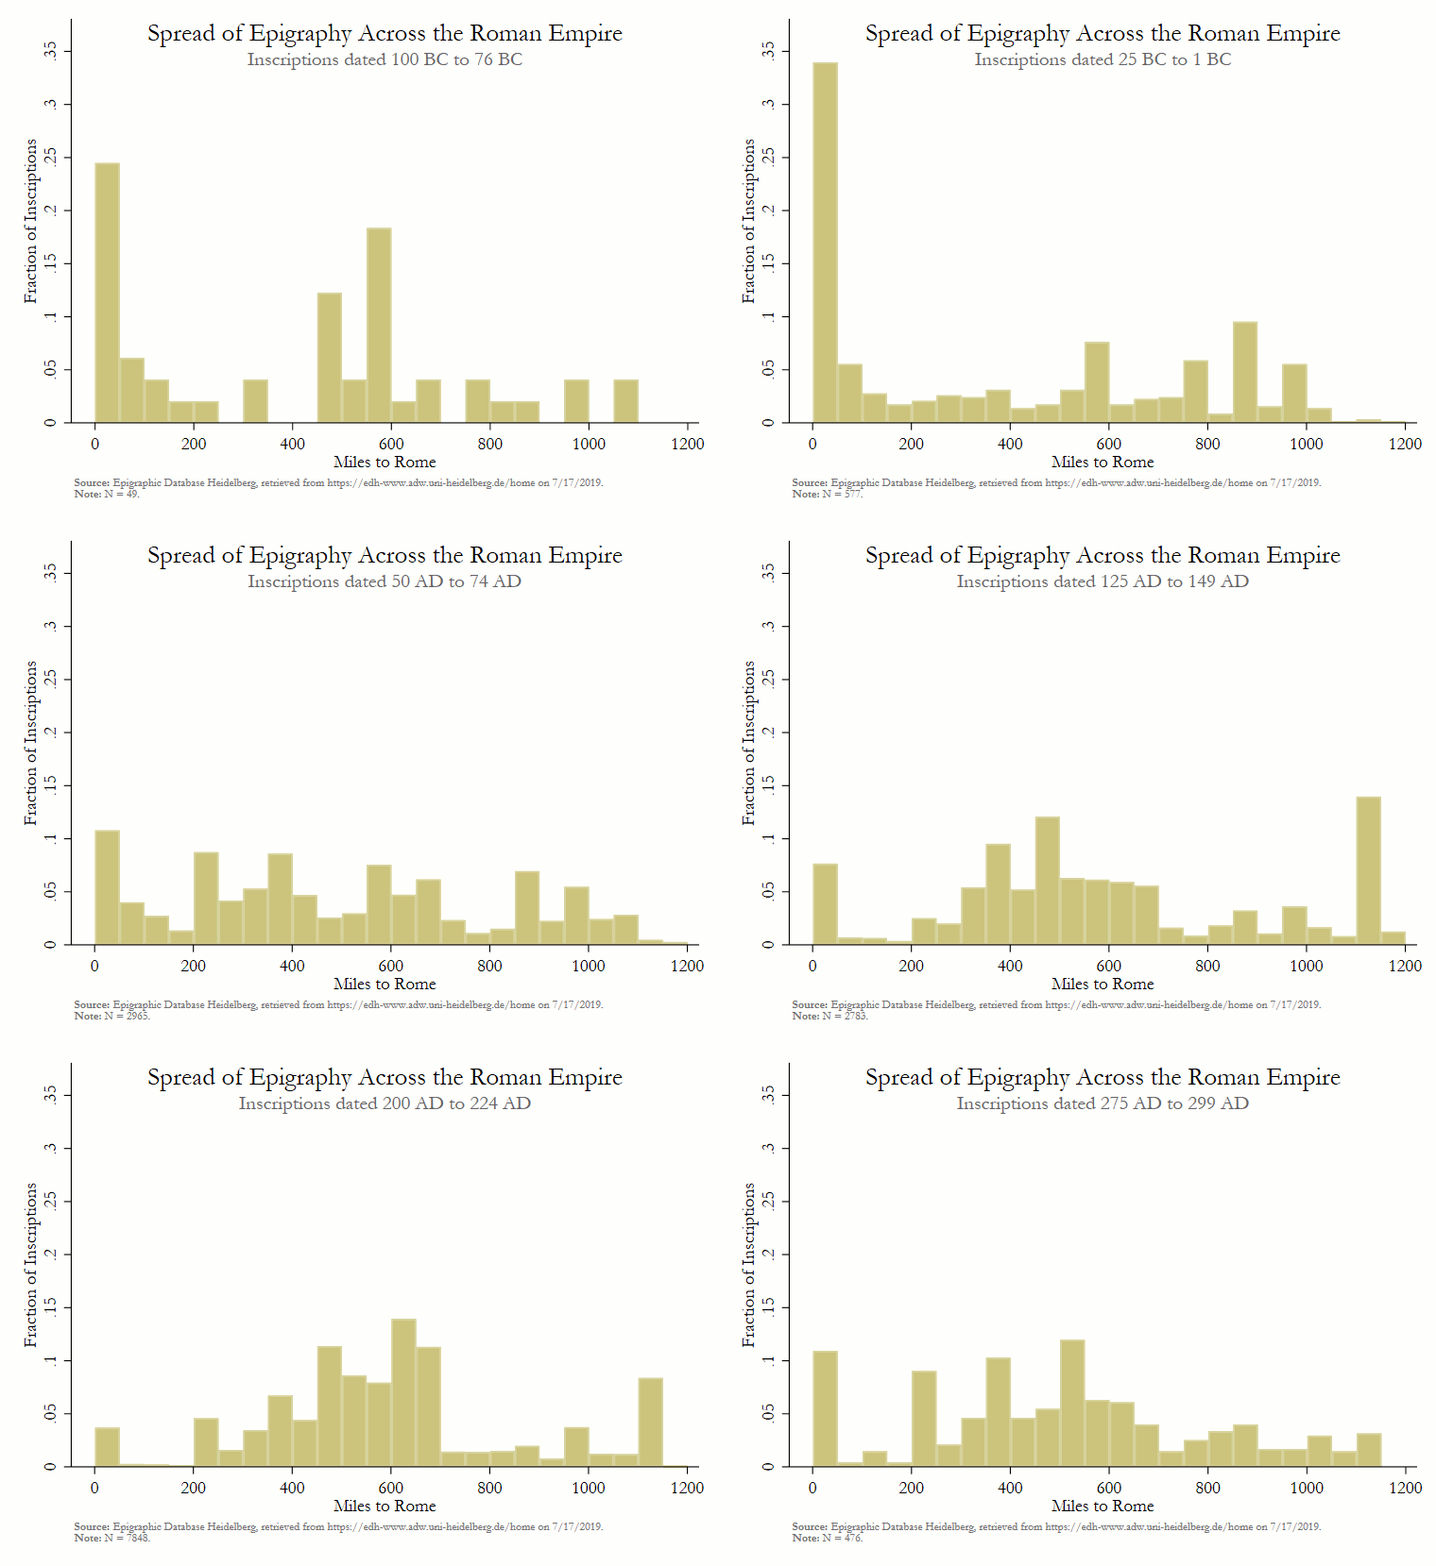
The geographic center of epigraphic activity shifted dramatically over the Empire’s lifespan. The animation below illustrates how the distribution of inscriptions evolved from 100 BC to 400 AD.

In 100 BC, almost 40% of all inscriptions originated from Rome itself. By 200 AD, that share had fallen to below 10%. This shift reflects the gradual diffusion of Roman culture and institutions throughout the provinces, as local elites adopted Roman practices of public writing to compete for status within their own communities.
The concentration of inscriptions between 200 and 250 miles from Rome comes primarily from the province of Dalmatia, a Balkan region particularly well-documented in the EDH dataset. This may reflect both the thorough Romanization of this strategically important region and the survival conditions that preserved these particular inscriptions.
This temporal pattern supports Wilson’s theory about local political competition: as Roman institutions took root in provincial communities, local elites increasingly used epigraphy to signal their status and compete for influence. The practice became less concentrated in Rome not because the capital declined, but because it had successfully exported its cultural and political practices to the periphery.
Implications
These patterns in Roman epigraphy offer insights into both ancient society and the universal dynamics of public expression. The geographic concentration around political centers, combined with gradual diffusion to peripheral areas, mirrors how cultural innovations spread in many contexts. The role of local political competition in driving public writing resonates with modern observations about how social media usage varies with community structure and audience composition.
Perhaps most importantly, the Roman evidence suggests that public writing serves as both personal expression and political tool. The inscriptions that survive represent individual desires to be remembered, but their geographic and temporal patterns reveal the broader social forces that shaped those individual choices.
Technical Notes and Source Code
The data include all geo-located inscriptions from the Epigraphic Database Heidelberg. Wilson suggests using these inscriptions as a proxy for Roman economic activity, making their geographic and temporal patterns particularly relevant for understanding imperial development.
Map Generation Code
import pandas as pd
import geopandas as gpd
import matplotlib.pyplot as plt
import numpy as np

#%% Read in shapefile and inscription data

directory = ""
map_df = gpd.read_file(directory + "\\provinces\\provinces.shp")
map_df.drop_duplicates(subset=["name"], keep='first', inplace=True)
df = pd.read_csv(directory + "\\map_data.csv")
df['label'] = df['map_province']
map_df['all_names'] = map_df['name']

#%% Merge datasets and filter out overlapping provinces.
# Set NaN values to 0.

merged = map_df.set_index('name').join(df.set_index('map_province'))
merged.replace({'num_inscriptions': {np.nan:0},
	            'num_persons': {np.nan:0},
				'volume': {np.nan:0},
                'inscriptions_per_km': {np.nan:0}}, inplace=True)

extra = ['Thessalia', 'Hellespontus', 'Caria', 'Lydia', 'Phrygia I',
         'Phrygia II', 'Pisidia', 'Hellespontus',
	 'Mauretania Sitifensis', 'Praevalitana', 'Epirus Vetus']
merged = merged[merged.num_inscriptions != 0 |
                merged.all_names.isin(extra)]

#%% Plot the map

merged['coords'] = merged['geometry'].apply(lambda x: x.centroid.coords[:])
merged['coords'] = [coords[0] for coords in merged['coords']]

fig, ax = plt.subplots(1, figsize=(30,24))
merged.plot(edgecolor='gray', column='inscriptions_per_km',
            ax=ax, cmap='OrRd')

# Label the provinces
for idx, row in merged.iterrows():
    if pd.notnull(row['label']):
        plt.annotate(s=row['label'], xy=row['coords'],
		horizontalalignment='center', size=12, color='.1')

# Title and notes
ax.axis('off')
ax.set_title('Density of Epigraphic Writing Across the Roman Empire',
             fontdict={'fontsize': '28', 'fontweight' : '5',
			 'fontname' : 'Times New Roman'})
ax.annotate('Source: Epigraphic Database Heidelberg accessed July 2019',
	        xy=(0.12, 0.1),  xycoords='figure fraction',
		horizontalalignment='left', verticalalignment='top',
		fontsize=18, color='#555555')

# Add a colorbar
vmin, vmax = 0, .11
sm = plt.cm.ScalarMappable(cmap='OrRd',
                           norm=plt.Normalize(vmin=vmin, vmax=vmax))
sm._A = []
cb = ax.get_figure().colorbar(sm, ax=ax, orientation='horizontal',
                             fraction=.1, shrink = .5, pad=-.1)
cb.set_label('Inscriptions per Sq. Kilometer', size=18)

fig.savefig(directory + "\\roman_inscriptions.png", dpi=400)
Animation Generation Code
use "working.dta", clear

	gen year_unif = runiform(not_before, not_after)
	egen year_bucket =  cut(year), at(-100(25)500)

	graph set window fontface "Garamond"

	forvalues i=0/15 {

		local yr `=-100 + 25 * `i''
		sum if year_bucket == `yr' & dist_rome < 1200
		scalar N = `r(N)'

		if `yr' < 0 {
			local time1 "`=`yr'*-1' BC"
			local time2 "`=`yr'*-1-24' BC"
		}
		else if `yr' > 0 {
			local time1 "`yr' AD"
			local time2 "`=`yr'+24' AD"
		}
		else {
			local time1 "1 AD"
			local time2 "`=`yr'+24' AD"
		}

		hist dist_rome if year_bucket == `yr' & dist_rome < 1200, xlabel(0(200)1200) width(50) frac ///
			xscale(range(0 1200)) yscale(range(0 .37)) ylabel(0(.05).35, nogrid) ///
			title("Spread of Epigraphy Across the Roman Empire", color(black) ring(0)) ///
			subtitle("Inscriptions dated `time1' to `time2'", color(gs6) ring(0) margin(0 0 0 6)) ///
			graphregion(color(white)) bgcolor(white) xtitle("Miles to Rome") ///
			ytitle("Fraction of Inscriptions") ///
			note("{bf:Source:} Epigraphic Database Heidelberg, retrieved from https://edh-www.adw.uni-heidelberg.de/home on 7/17/2019." ///
				 "{bf:Note:} N = `=N'.", color(gs7) size(vsmall))
		graph export "output/spread frames/Frame `yr'.png", width(760) replace
	}
Sources
Steiner, Jakub. “Simple Animations.” 2002. https://www.gimp.org/tutorials/Simple_Animations/.
Tags: economic history, data, Stata, python